
| Net Sales | Operating Income | Ordinary Income | Net Income | Net Income per Share(Unit:yen) |
Net Income on Own Capital(%) |
Net Assets | Total Assets | Equity Ratio (%) | Net Assets per Share(Unit:yen) |
Operating CF | Investing CF | Financing CF | No. of employees(persons) |
|
|---|---|---|---|---|---|---|---|---|---|---|---|---|---|---|
| FY2021 | 50,356 | 3,139 | 3,215 | 1,978 | 183.42 | 12.0 | 17,604 | 51,283 | 33.9 | 1,614.29 | 2,528 | -1,226 | -719 | 903 |
| FY2022 | 53,479 | 3,414 | 3,587 | 2,348 | 217,72 | 12.7 | 19,665 | 72,170 | 27.0 | 1,803.23 | 1,907 | -1,718 | -5 | 935 |
| FY2023 | 59,591 | 3,964 | 4,018 | 2,004 | 187.71 | 10.0 | 20,774 | 57,051 | 36.1 | 1,937.23 | 5,506 | -852 | -941 | 964 |
| FY2024 | 61,256 | 2,311 | 2,534 | 1,850 | 173.88 | 8.7 | 22,294 | 61,747 | 35.8 | 2,071.18 | 3,021 | 239 | -765 | 1,005 |
| FY2025 (estimated settlement) |
67,500 | 3,500 | 3,530 | 2,530 | 236.82 | - | - | - | - | - | - | - | - | - |
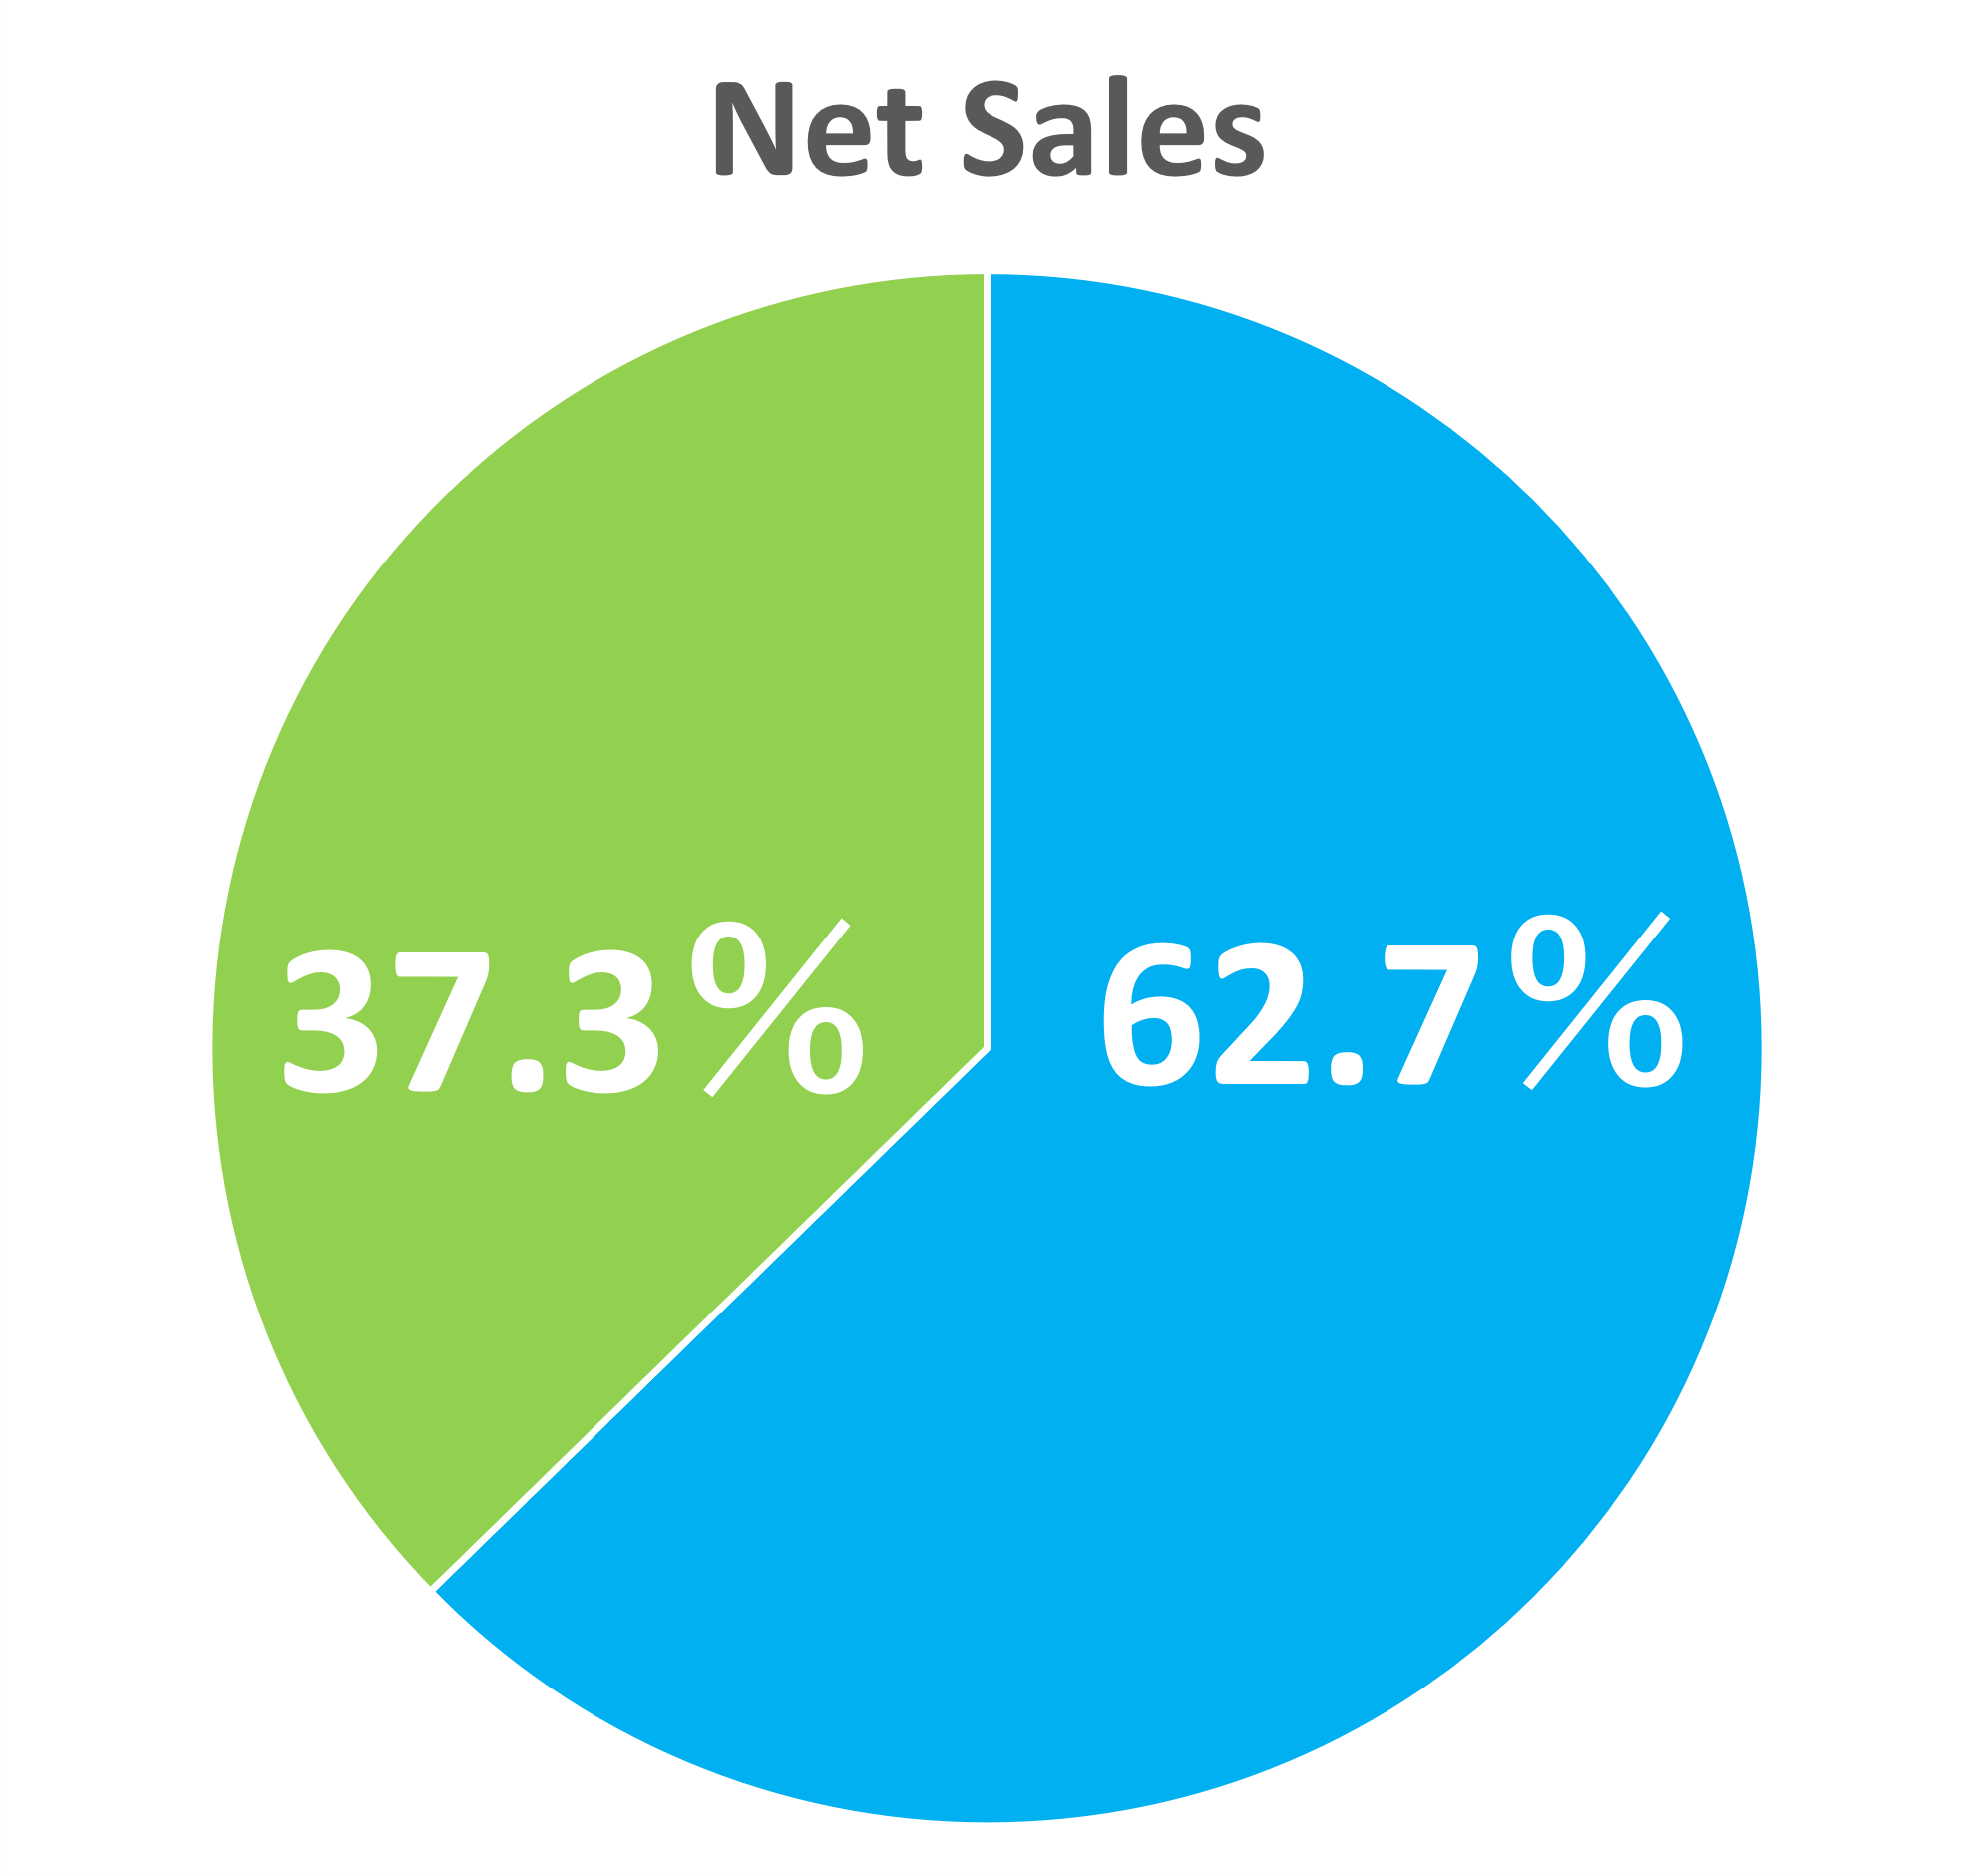
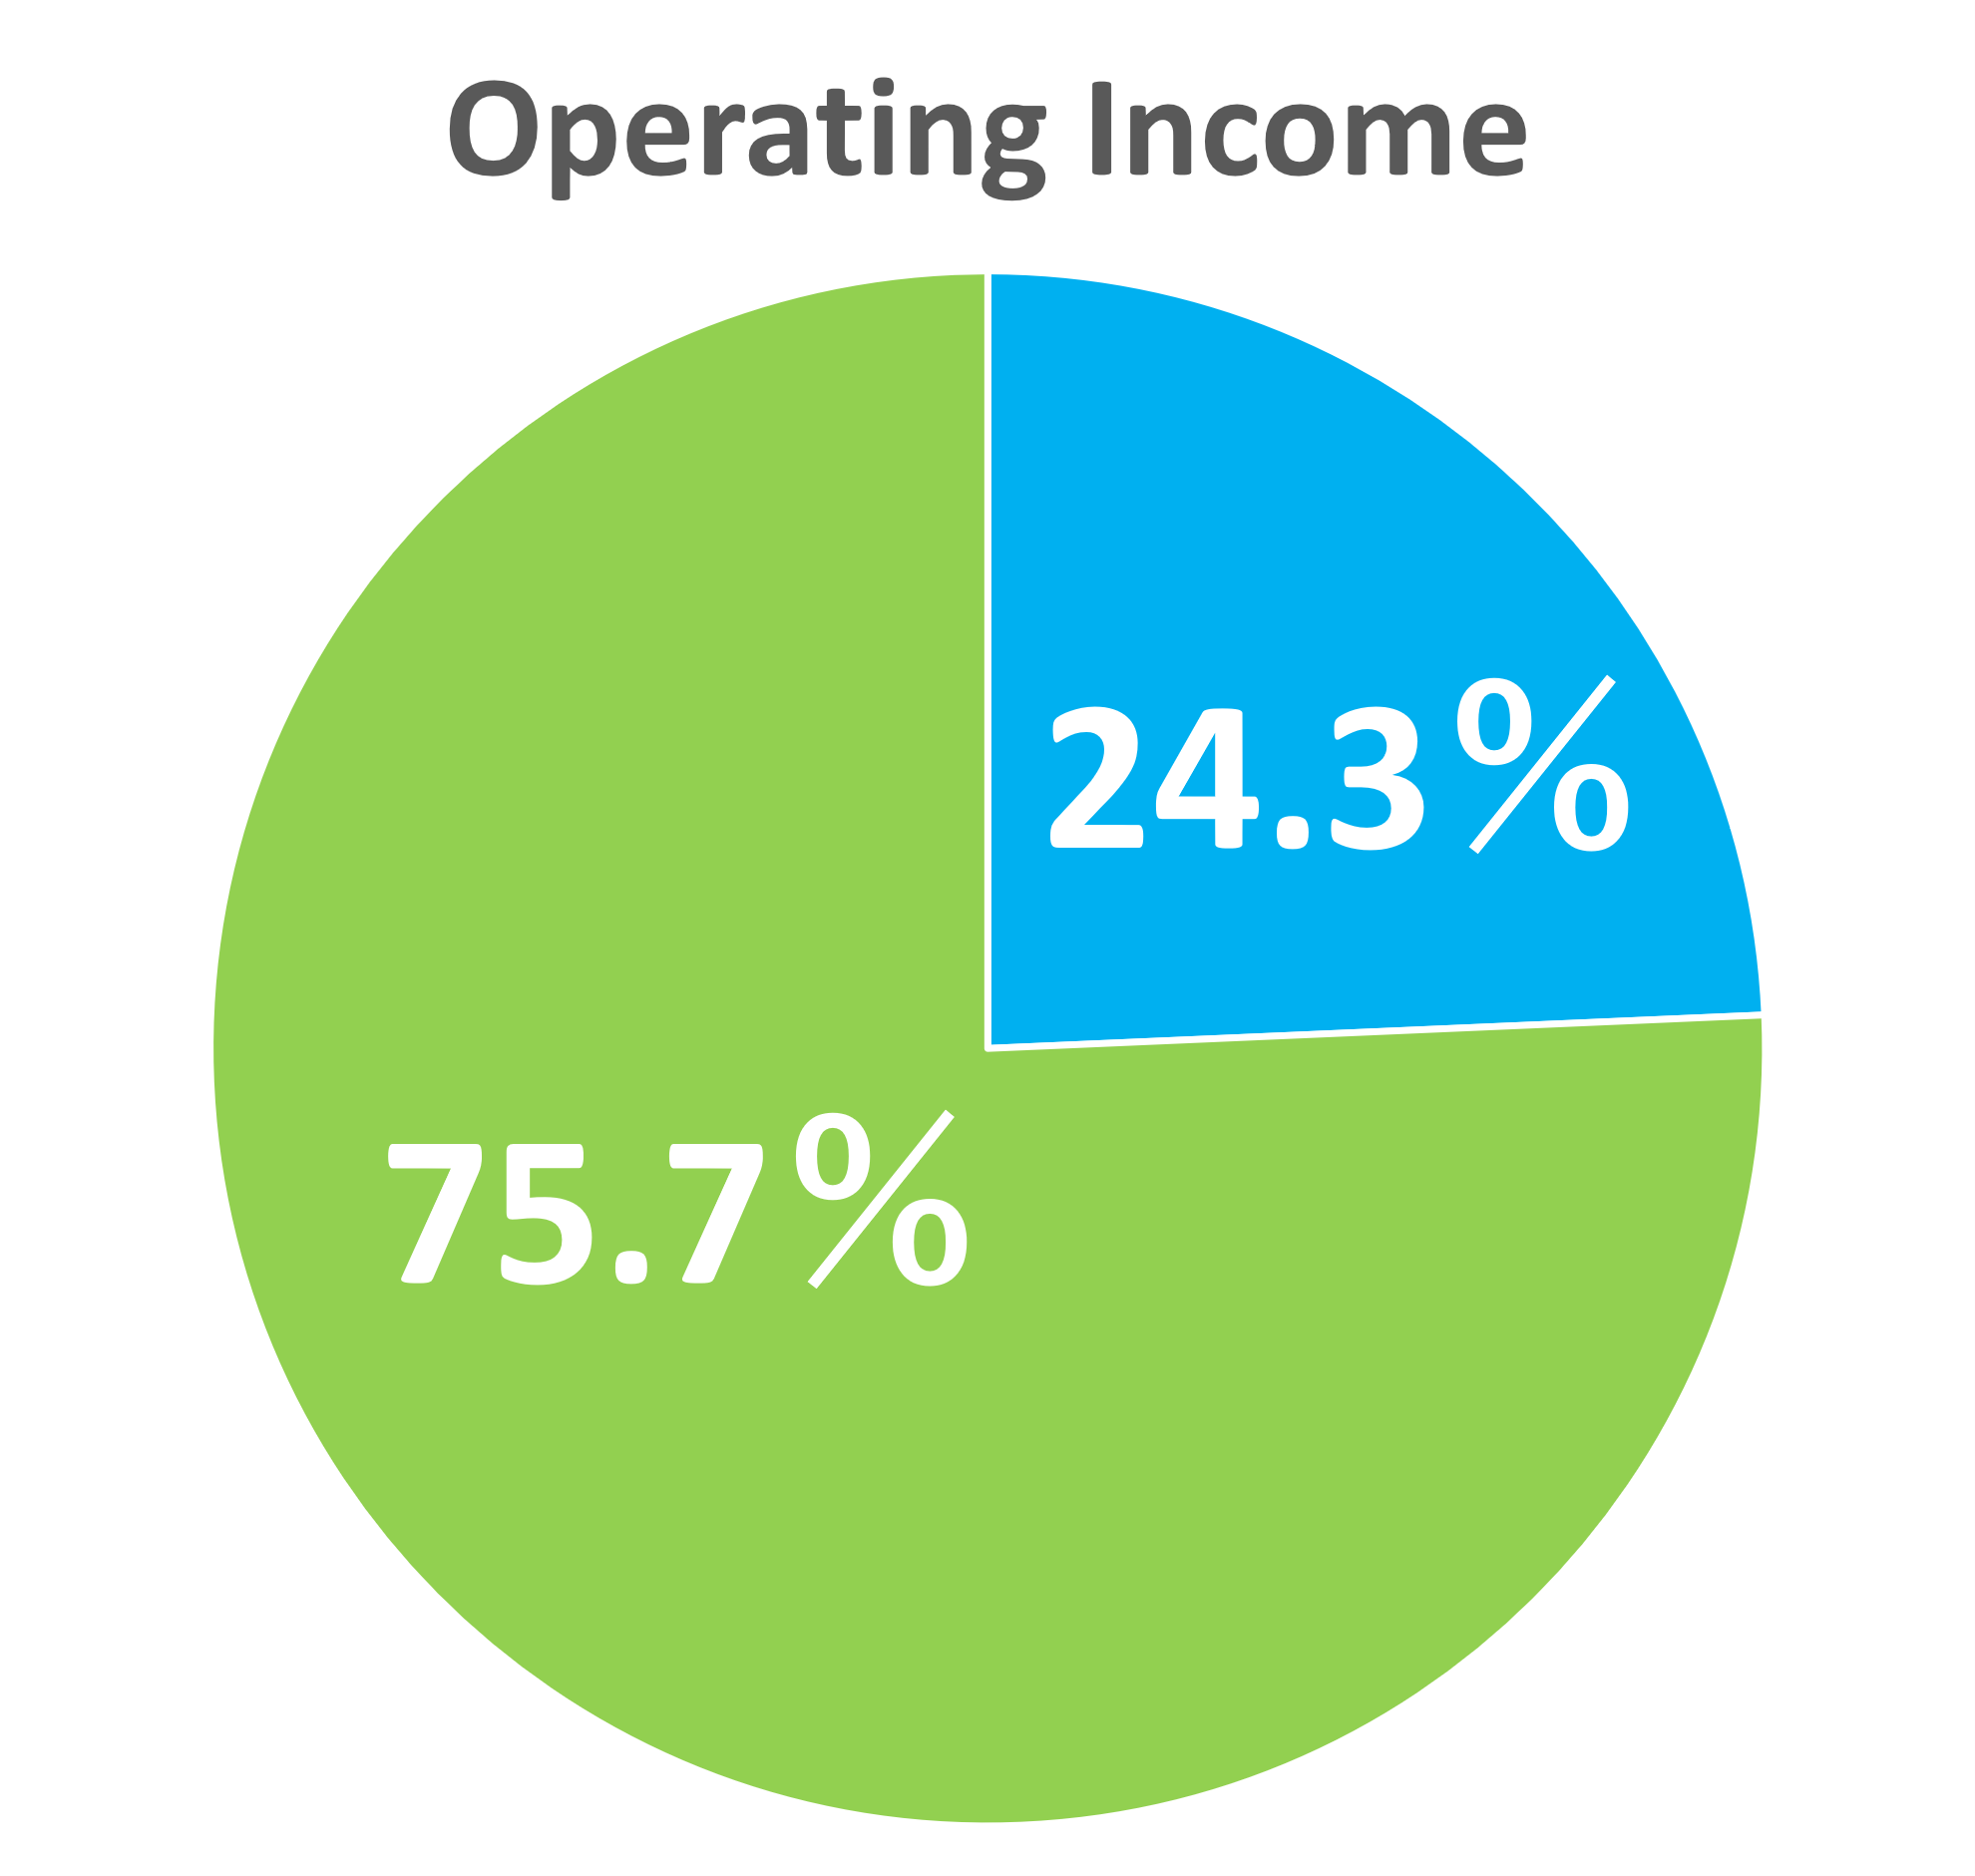
| Information services business |
Payment agency services business |
|||
|---|---|---|---|---|
| Net Sales | Operating Income | Net Sales | Operating Income | |
| FY2020 | 27,147 | 2,074 | 18,604 | 772 |
| FY2021 | 30,705 | 2,307 | 19,671 | 899 |
| FY2022 | 31,432 | 1,585 | 22,094 | 1,832 |
| FY2023 | 35,728 | 1,416 | 23,968 | 2,546 |
| FY2024 | 37,389 | -278 | 23,974 | 2,579 |
Payment agency servises business
Information services business